Analytics & Reports
Understand your finances with Zerosum analytics. Explore spending, income, net worth, forecasts, custom dashboards, and more.
Written By Pedro
Last updated 3 days ago
See the big picture. Track your net worth, understand spending patterns, analyze income, forecast ahead, and build custom dashboards tailored to how you actually use the app.
The analytics dashboard
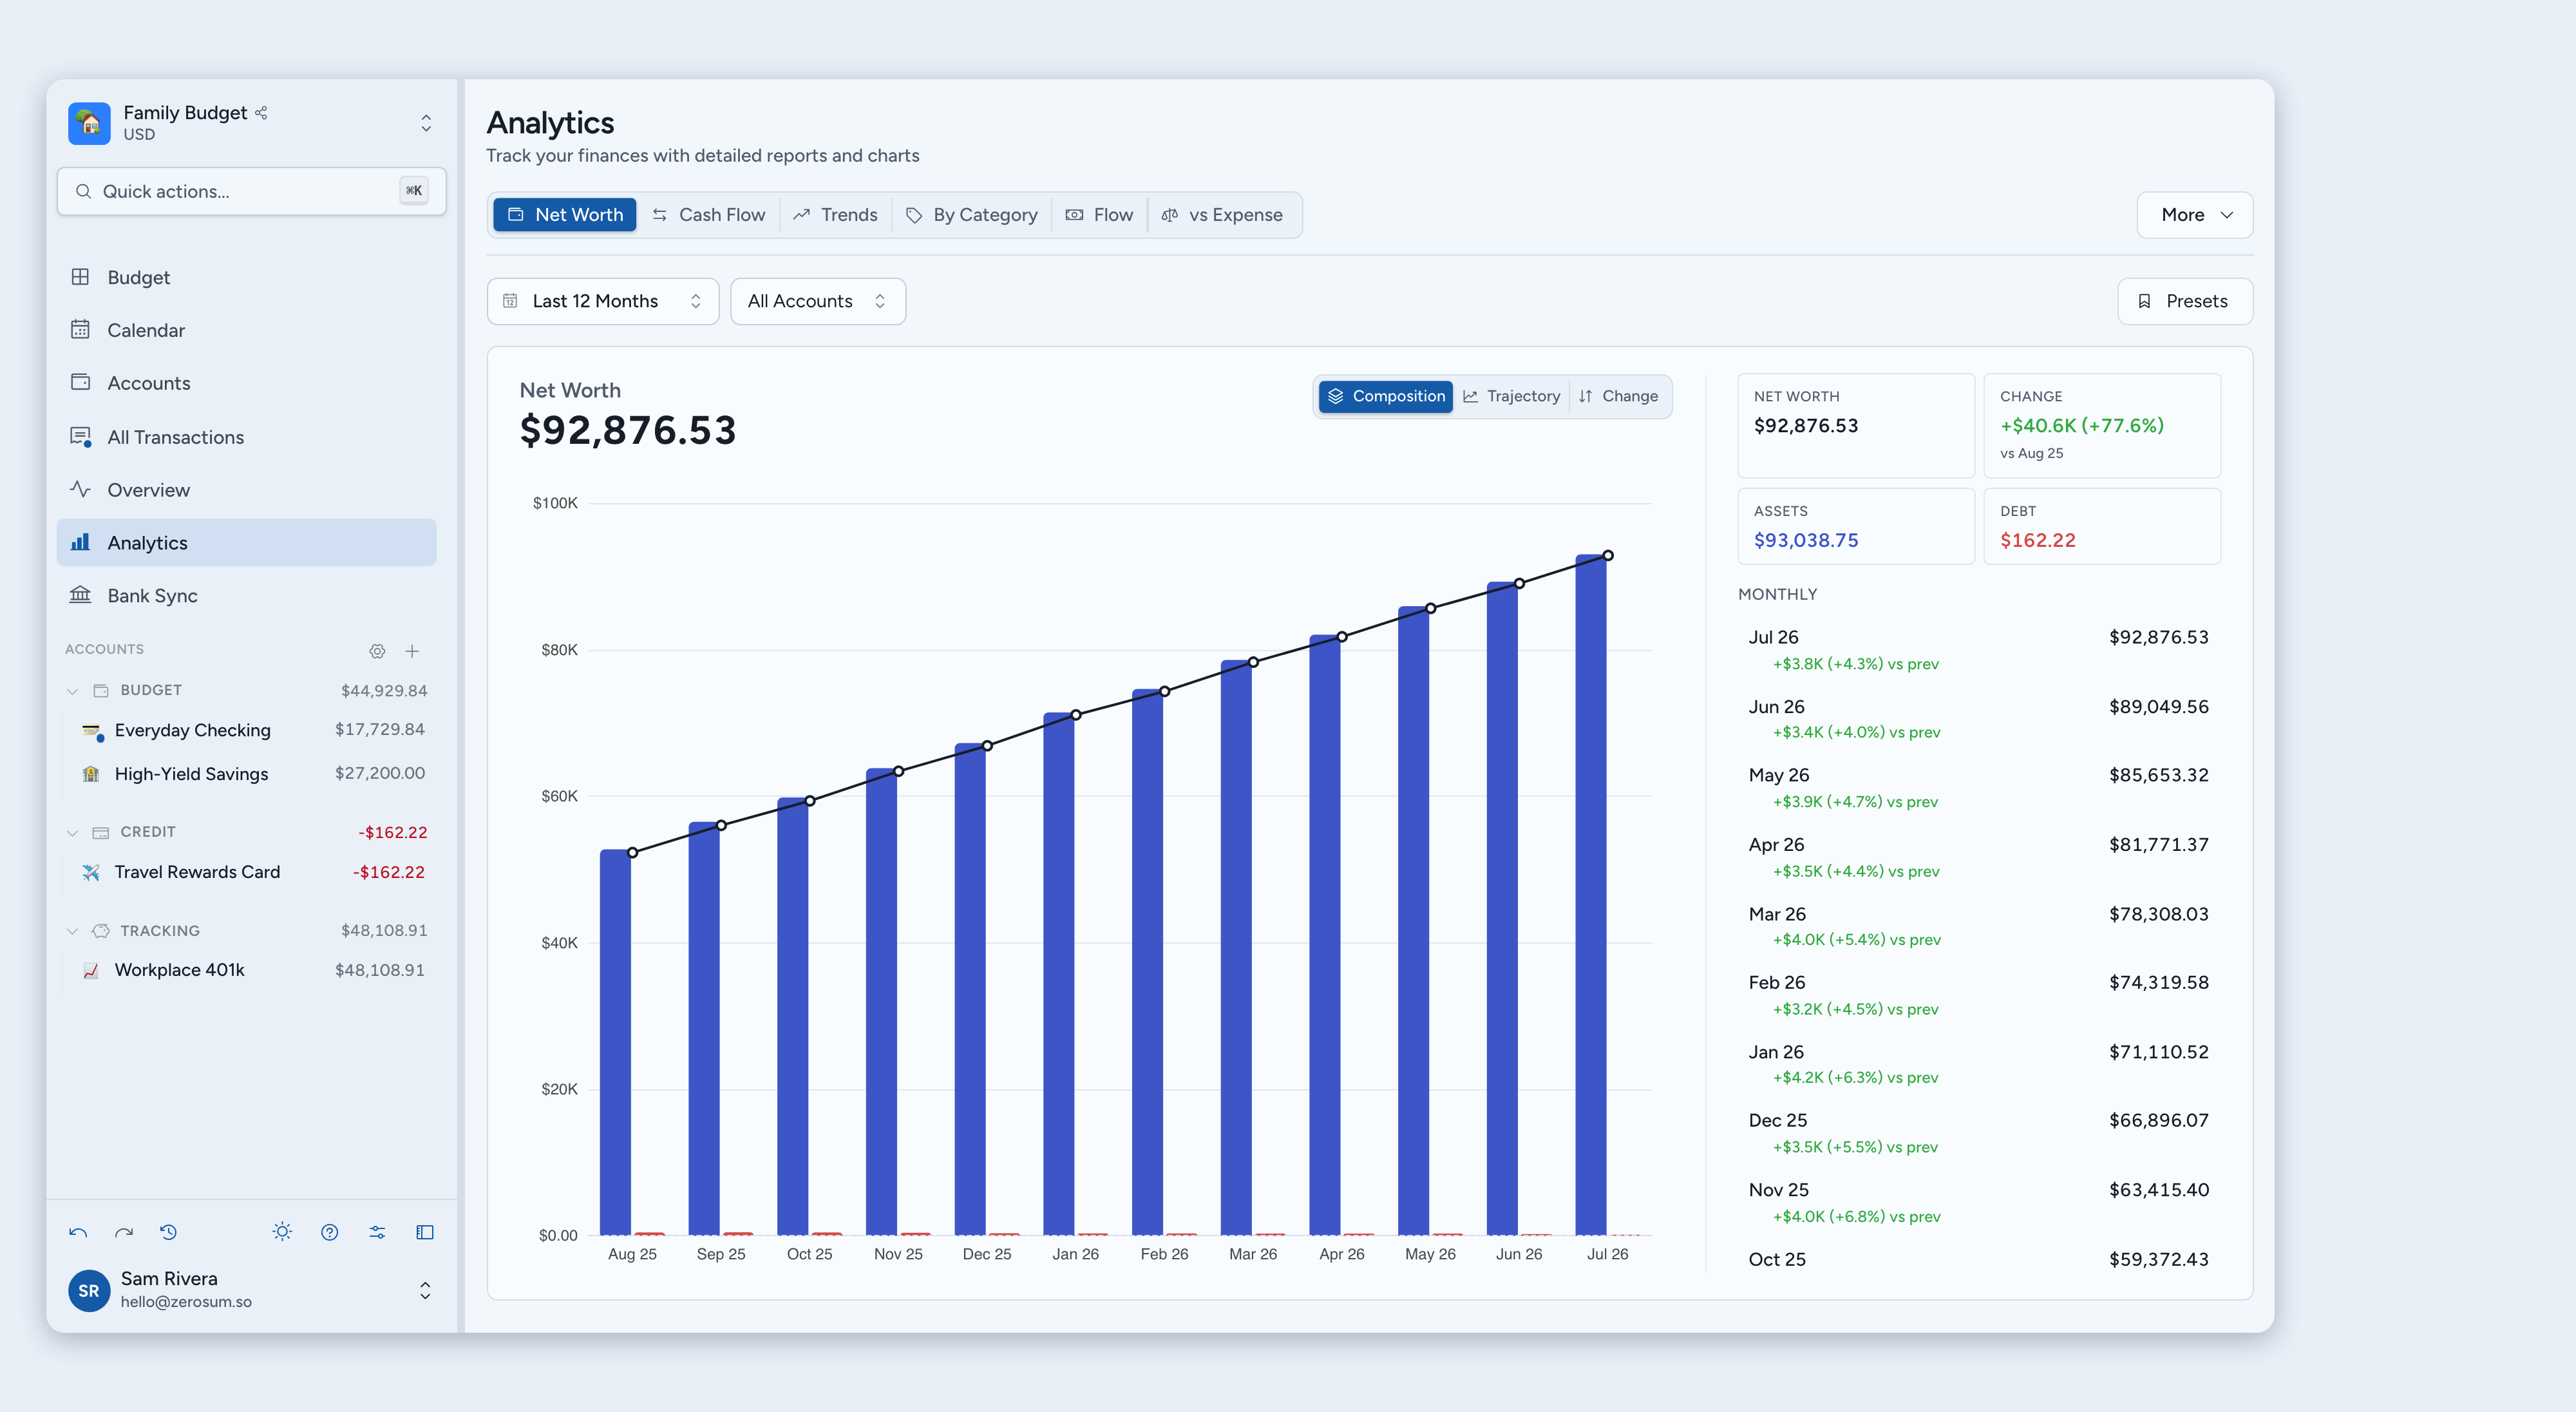
The analytics menu is a customizable chip bar at the top of the page. Up to 10 views or custom dashboards stay pinned as one-click chips; the rest live in a More dropdown. The leftmost pinned chip is your landing view, what opens when you click Analytics from the sidebar.
Use Customize menu… inside the More dropdown to pin, unpin, and reorder views and dashboards; you can also rename or delete your own dashboards there (built-in views can't be renamed or deleted). Drag the grip on any row to reorder within a group. Built-in views and custom dashboards are first-class peers, so pin whichever combination matches how you work. On narrow viewports the chip bar collapses to a single dropdown showing every view at once.
Built-in views
- Overview: Net Worth, Cash Flow, Balances, Savings Rate, Runway, Year over Year, Report
- Spending: Trends, By Category, By Payee, By Tag
- Income: Flow, vs Expense, Breakdown
- Forecast: a net-worth projection
- Planning: Retirement
💡 Tip: check analytics weekly or monthly to spot trends early and adjust your budget before small issues become big ones.
Filtering your data
On built-in views, a filter bar below the chip bar lets you zero in on exactly the data you care about. Filters apply to the active chart and are remembered per view, syncing across your devices. Custom dashboards use per-widget filters instead: open any widget's gear (Widget settings) to scope it.
- Categories: multi-select categories grouped by category group, for isolating a spending area like food or transport.
- Accounts: context-aware. Each view shows the relevant account types: budget reports use budget and credit-card accounts, Cash Flow adds tracking accounts, and Savings Rate folds in your asset tracking accounts.
- Payees: on most views (all Spending views, Cash Flow, Runway, Year over Year, and the income views), narrows results to one or more merchants or income sources.
- Tags: on views that support it, narrows results to transactions carrying specific tags.
- Date range: This Month, Last Month, Last 3 Months, Last 6 Months, Last 12 Months, This Year, Last Year, All Time, or a Custom range. New views open on Last 12 Months.
ℹ️ Filters are remembered per view. When you come back to a view, Zerosum restores the filters you had last time, and that choice syncs across your devices. Click Clear to reset a view to its defaults. Other knobs stick the same way, like the Forecast horizon and the Savings Rate exclude-current-month option.
Filter presets
Presets save a named snapshot of your current filters (view, categories, accounts, payees, tags, date range, and each filter's Include or Exclude mode) so you can jump back to a favorite analysis with one click.
- Save a preset: set your filters, then click Save current filters in the filter bar's preset menu and give it a name. The dialog shows a summary of exactly what's being saved.
- Load a preset: click a preset name to instantly restore that view, its filters, and each filter's Include or Exclude mode.
- Update a preset: when a preset is loaded and you tweak its filters, an Update Preset button appears so you can save the change.
- Delete a preset: remove presets you no longer need from the list.
ℹ️ Shared with all budget members: preset definitions are stored per budget and visible to everyone with access. Which preset each member currently has applied on a view is private, so two members can look at different presets at the same time.
Inflow, income, spending, and expenses
These four words look interchangeable, but each answers a different question, which is why their totals rarely match. Knowing which one a report uses explains most "these numbers don't agree" moments.
Money in: inflow vs income
- Inflow (Cash Flow) is any positive transaction that survives your selected account boundary, whatever its category or account type. A dividend paid straight into an investment account, a refund, or a balance adjustment all count.
- Income (Income vs Expense, Income Flow, Savings Rate) is only money categorized as income, such as Ready to Budget, on your budget and credit-card accounts. Activity inside tracking accounts is never income.
That is why Cash Flow inflow is usually the larger number. A salary sent to Ready to Budget is both. A dividend landing directly in a brokerage account, a store refund, or a transfer from savings back to checking can each be an inflow without being new income.
Money out: outflow vs spending vs expenses
- Outflow (Cash Flow) is every negative transaction that survives the account boundary, counted by sign. It ignores categories.
- Spending (Spending views, Runway) is category-based: normal spending categories only, with refunds and credits subtracted. Credit-card payments never count, because the original purchase already did.
- Expenses (Income vs Expense) use that same spending logic with one change: transfers into asset tracking accounts are pulled out and shown separately as Savings.
So a move from Checking to an Investment account can be an outflow in Cash Flow, vanish from Cash Flow when both accounts are selected, and appear as Savings rather than an Expense in Income vs Expense. Transfers to a loan or a liability tracking account stay on the expense side instead, depending on how the budget-side row is categorized.
Spending analysis
The Spending tab breaks down where your money goes across four views, all filterable by category, account, payee, tag, and date range.
By Category
A donut chart shows each category's share of total spending. Hover for exact amounts. The summary panel ranks every category by spend to help identify savings opportunities.
By Payee
The same donut layout grouped by merchant. Use this to find forgotten subscriptions or any payee you're spending more with than expected.
By Tag
The same donut layout grouped by tag, so you can see how much a project, trip, or any tagged theme cost across categories.
Trends
A stacked bar chart shows spending by category over time: each bar is a month, each colored segment a category. Ideal for spotting seasonal patterns or month-over-month changes.
ℹ️ Transfer handling: internal transfers between your accounts are excluded from spending by default. Two exceptions: loan payments (a transfer to a loan account counts as spending when it uses a normal category) and categorized Budget → Tracking transfers (setting a normal category like "Savings" when moving money to a tracking account makes it count as spending). Cash Flow uses a separate account-flow rule based on the accounts you select: a transfer that stays wholly inside your selected accounts is internal and left out, while a transfer that crosses the boundary of that selection counts once, from the selected side.
Net worth & overview
Net worth is everything you own (assets) minus everything you owe (liabilities): checking, savings, investments, and property against credit cards, loans, and mortgages. The Overview tab tracks this and related metrics over time.
Cash Flow
A bar chart comparing inflow and outflow month by month across budget, credit-card, and tracking accounts. The accounts you select define a boundary: a transfer that stays wholly inside that selection is internal and left out, so moving your own money doesn't inflate the bars, while a transfer that crosses the boundary counts once, from the selected side. Loan accounts always sit outside this universe, so a loan payment is an outflow and a disbursement from a loan is an inflow.
ℹ️ Two levers control transfers here. The account filter sets the boundary: narrow the selection and a transfer that used to be internal can start counting. Select only your checking account, for example, and a move from it to a tracking account now crosses the boundary and shows as an outflow. The payee filter is the harder switch: exclude the matching Transfer item and those transfers drop out entirely, from both sides, whatever the account boundary would otherwise do.
Savings Rate
The share of your budget income you keep rather than spend each month. It uses the same basis as Income vs Expense, so with no asset tracking accounts the two match exactly. When a tracking account is marked as an asset (the default), transfers into it count as saving rather than spending. Savings Rate hides the current partial month by default so late-month income timing doesn't distort the trend. Aim for at least 20% as a benchmark, though any positive rate is a good start.
Balances
Tracks each account's balance over time as individual lines. Use the account filter to compare specific accounts or focus on one.
Net Worth Forecast
Projects your net worth forward from a simulation of your past monthly changes, drawn as a median line with confidence bands. The date filter sets how much history trains it (defaulting to all time); narrow the window so an old import or a stretch that no longer reflects your trajectory doesn't drag the projection down. The slider on the right sets how far ahead to project.
Runway
How many months your savings could cover your average expenses, so how long your money would last without income. Available assets are your budget and credit-card balances plus your asset tracking balances, the savings you could actually live on; liability tracking accounts and loans never count. Burn is your average spending across budget and credit-card accounts only, so a transfer into a savings account is never counted as burn, its value already sits in your assets.
- 1–2 months: minimal buffer
- 3–6 months: standard emergency fund
- 6–12 months: strong position
- 12+ months: excellent financial security
Year over Year
Compares the same metric across calendar years side by side. Useful for annual cycles like holiday spending or tracking long-term improvement. It follows the same spending framing as Spending by Category and Trends, so normal-category Budget → Tracking transfers are counted.
Using tracking accounts
Add tracking accounts for retirement, brokerage, real estate, and vehicles. Update balances monthly or quarterly. Tracking accounts don't affect your spending budget, but they participate in Cash Flow, Savings Rate, Net Worth, Forecast, and Balances.
Asset or liability. Each tracking account is an asset by default, but you can mark it as a liability. The setting never affects your budget or net worth, which always follows the balance itself. It changes how transfers into the account read: into an asset they count as saving; into a liability they read as spending. Switch it any time from the account's edit dialog.
Income analysis
Three views for understanding what comes into the budget layer and how it relates to spending, using budget and credit-card accounts. Direct tracking income is excluded; Ready to Budget transfer rows are grouped as Transfer: account name and count with their signed amount.
Income Flow
Income grouped by source (payee) over time. Track primary income, side income, or month-to-month variation.
Income vs Expense
A monthly table listing income, expenses, and net for each period. Normal-category Budget → Tracking or Budget → Loan transfers appear on the expense side; Ready to Budget transfers appear on the income side as signed rows. Supports CSV export (see Exporting data).
Why doesn't Monthly Net match Net Income?
They answer different questions, so they rarely match exactly. Net Income is an income statement: categorized budget income minus categorized budget spending, across budget and credit-card accounts only. The Monthly Net widget is cash flow: every inflow minus every outflow, across budget, credit-card, and tracking accounts.
- Account scope: Monthly Net also counts tracking accounts, including interest added to them directly. Net Income never sees tracking activity.
- Transfers to savings: an internal move nets to zero in Monthly Net, but counts as spending in Net Income once you give it a category.
- Uncategorized rows: Monthly Net counts them by sign; Net Income leaves them out until categorized.
Income Breakdown
A Sankey diagram showing how income flows into expense categories. Flow widths represent proportions, revealing which categories consume the largest share of earnings. Ready to Budget transfers to an asset tracking or loan account stay in Net Gain as retained value, while transfers to a liability tracking account count as spending.
Monthly report
A self-contained summary of a single month, opened from the Overview group's Report chip. Navigate between months with the arrow buttons, or jump back with Today. It leads with Net Income and your savings rate, then a stat grid (Income, Expenses, Transactions, average per day), your top categories, payees, and tags, your five biggest transactions, and a six-month context strip.
💡 Tip: use the monthly report for a quick end-of-month review: how much came in, what you spent it on, and where it went.
Exporting data
The Income vs Expense table has an Export button that downloads a CSV. The export respects active filters, so you can export a specific date range, account subset, or category selection. It downloads as income-vs-expense-YYYY-MM-DD.csv with the export date in the filename.
💡 Tip: set a date filter before exporting, for example "This Year" for annual tax prep or a custom range for a specific project.
Custom dashboards
Assemble your own view by combining charts, stats, and insights into a single scrollable page. Open the More dropdown to see existing dashboards or create a new one, then pin it to the chip bar so it's always one click away.
Creating a dashboard
- Open the More dropdown and click New dashboard (also available inside Customize menu).
- Enter a name.
- Click Add Widget to open the widget catalog.
- Select widgets and add them.
- Optionally open Customize menu… and pin the dashboard so it shows as a chip.
Widget types
The catalog has 29 types across four groups:
- Summary Cards: Net Worth, Net Worth Change, Total Spending, Total Income, Savings Rate, Savings Rate Trend, Monthly Net
- Insights: Top Category, Runway, Top Payees, Top Transactions, Spending vs Last Month, Income vs Last Month, Income Ratio
- Charts: any analytics view as a compact widget (including Retirement Projection), plus Category Monthly Tracker (one category's spending over 6 or 12 months) and Cumulative Spending (this month's running total against your average pace, with an on-pace badge and month-end projection)
- Visualizations: Spending Heatmap, Period Comparison, Category Sparklines
Editing a dashboard
- Reorder widgets: click Arrange to open a side sheet, then drag the grip on any row.
- Per-widget filters: click the gear on any widget to scope its accounts, categories, payees, and tags. Two Net Worth widgets can show different account sets on the same dashboard.
- Rename a widget: open its gear (Widget settings) and set a custom name.
- Dashboard date range: a single date picker at the top scopes all widgets, though some (like Cumulative Spending) use their own window.
- Remove or delete: click the X on any widget, or use the ⋯ menu in the header to rename or delete the dashboard.
Getting the most from analytics
- Review weekly to catch overspending before the month is over.
- Save filter presets to return to common views in one click.
- Compare periods with Year over Year and period-comparison widgets.
- Build a dashboard from the 5–6 charts you care about most.